Ingesting Terminal Logs with Loghead Cloud

A step-by-step guide to streaming and analyzing your terminal logs directly in the Loghead Cloud UI.

# Step-by-Step Setup

Create a New Project

Navigate to your Loghead Cloud dashboard and click 'New Project'. Give your project a recognizable name to organize your logs.

Creating a new project in the Loghead Cloud dashboard

Creating a new project in the Loghead Cloud dashboard

Add a Terminal Data Stream

Inside your project, click on 'Add Stream' and select 'Terminal' as the stream type.

Selecting 'Terminal' as the data stream type

Selecting 'Terminal' as the data stream type

Get Your Ingestion Credentials

Once the stream is created, Loghead will generate a unique Stream ID and an Ingestion Key. Copy these credentials.

Configure Your Environment

Export the credentials as environment variables in your local terminal or CI/CD pipeline.

Using the CLI ingestion command in a project configuration file

Using the CLI ingestion command in a project configuration file

CODE
export LOGHEAD_STREAM_ID=your_stream_id export LOGHEAD_API_KEY=your_api_key

Stream Your Logs

Pipe your command outputs directly to Loghead using our CLI tool.

CODE
npm run build | npx @loghead/terminal

Universal Terminal Logging in Loghead Cloud

Streaming terminal logs to Loghead Cloud provides real-time observability for your build processes, cron jobs, and custom CLI tools.

terminal — zsh
npm run build | npx @loghead/terminal
[Loghead] Streaming logs... [Loghead] Successfully ingested 42 log lines.
ERROR
AI Insight:

Why Ingest Terminal Logs?

When running complex build processes (like Next.js builds or Docker image generation) or long-running CI/CD scripts, keeping track of the terminal output across multiple environments can be challenging. By piping these logs directly to Loghead Cloud via the UI integration, you gain:

  • Centralized storage for all your terminal outputs.
  • Powerful search to quickly find errors or warnings across historical runs.
  • Shareable URLs to send specific log traces to team members.

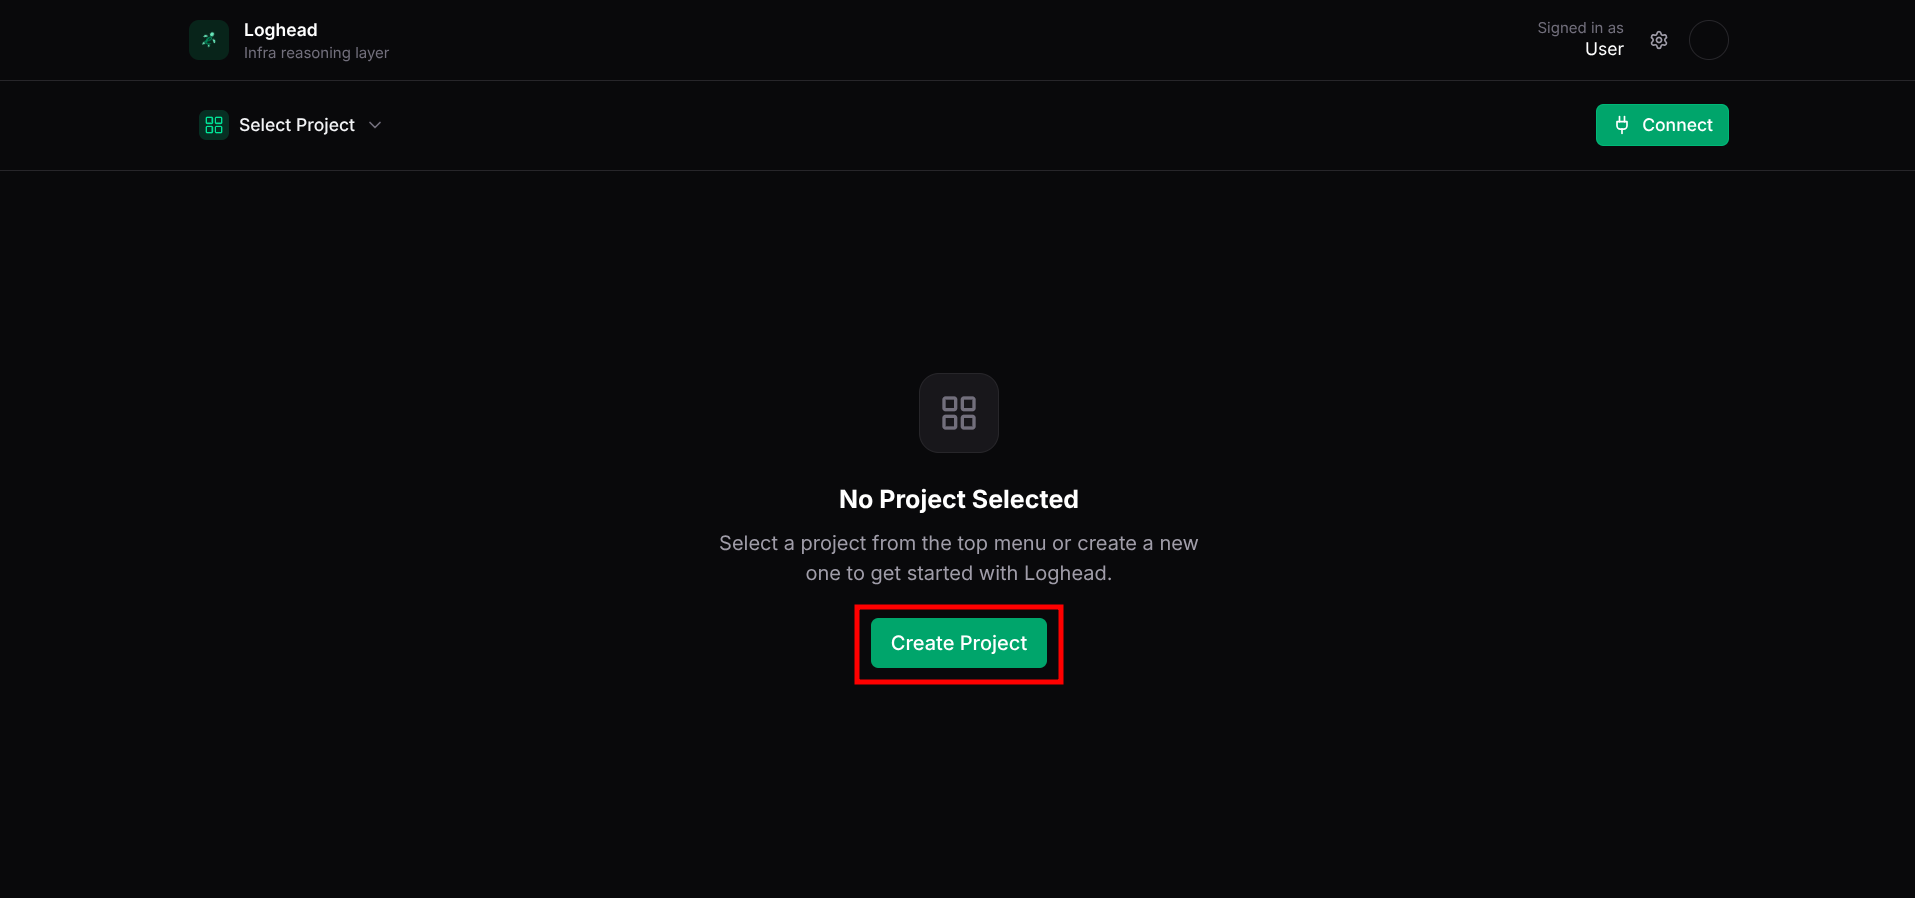
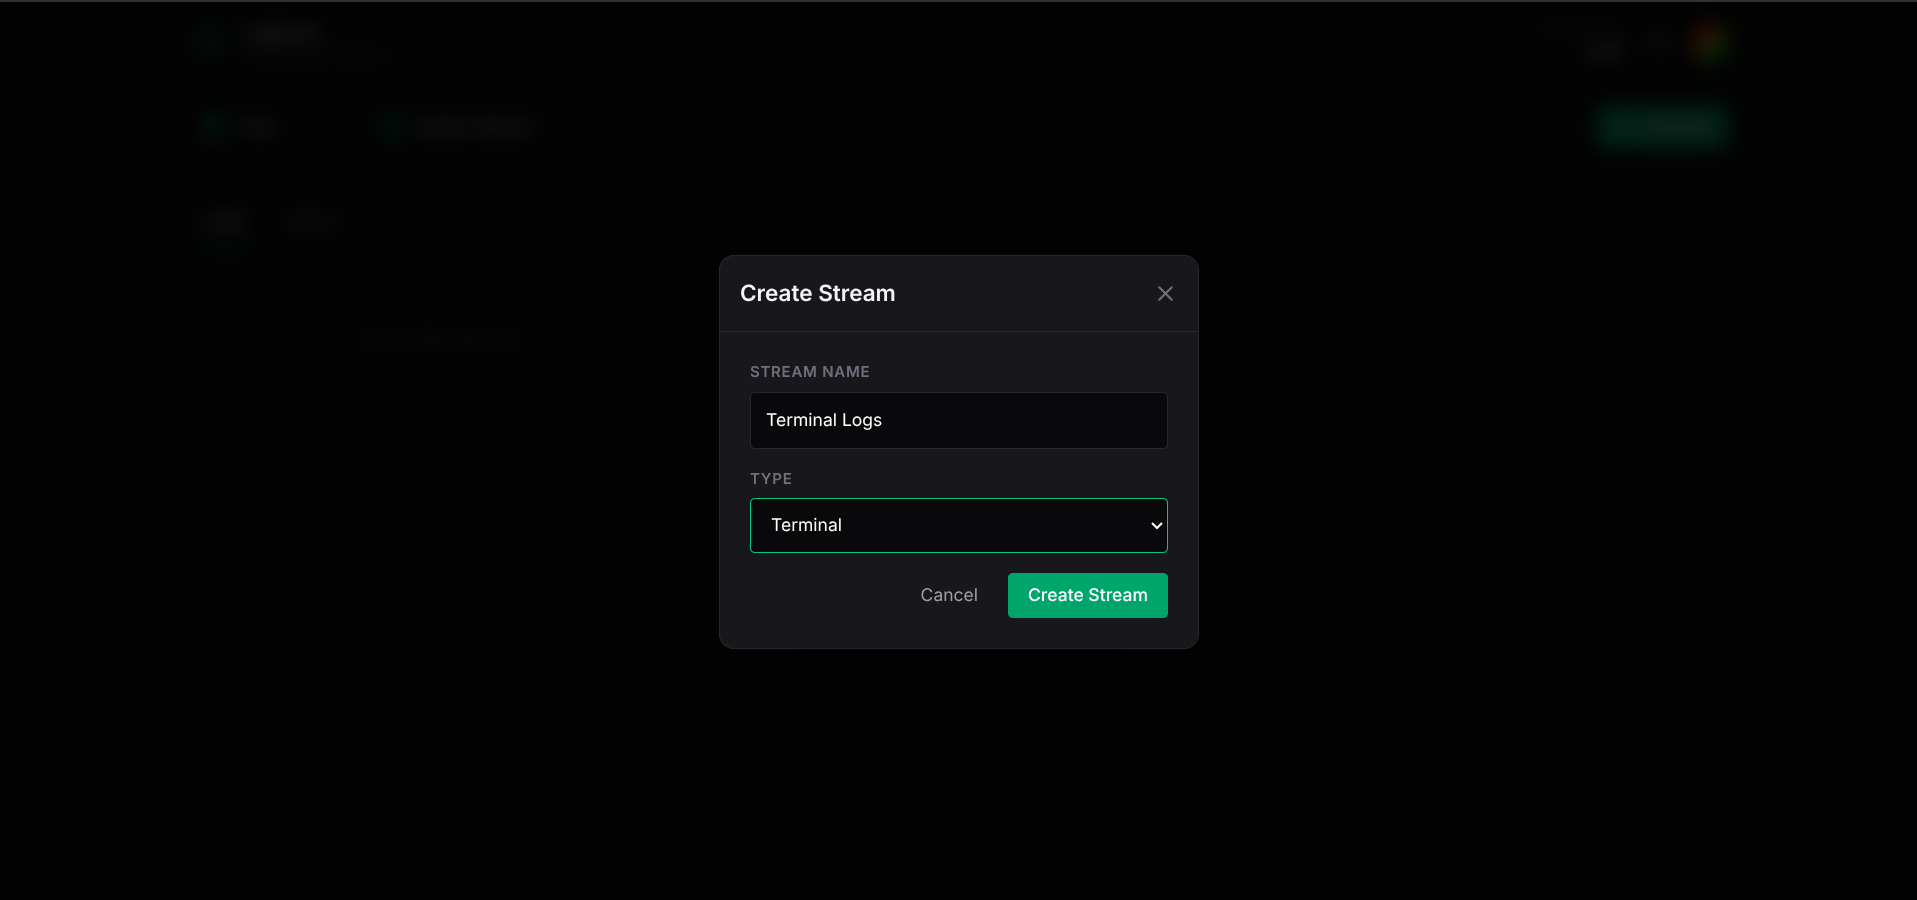
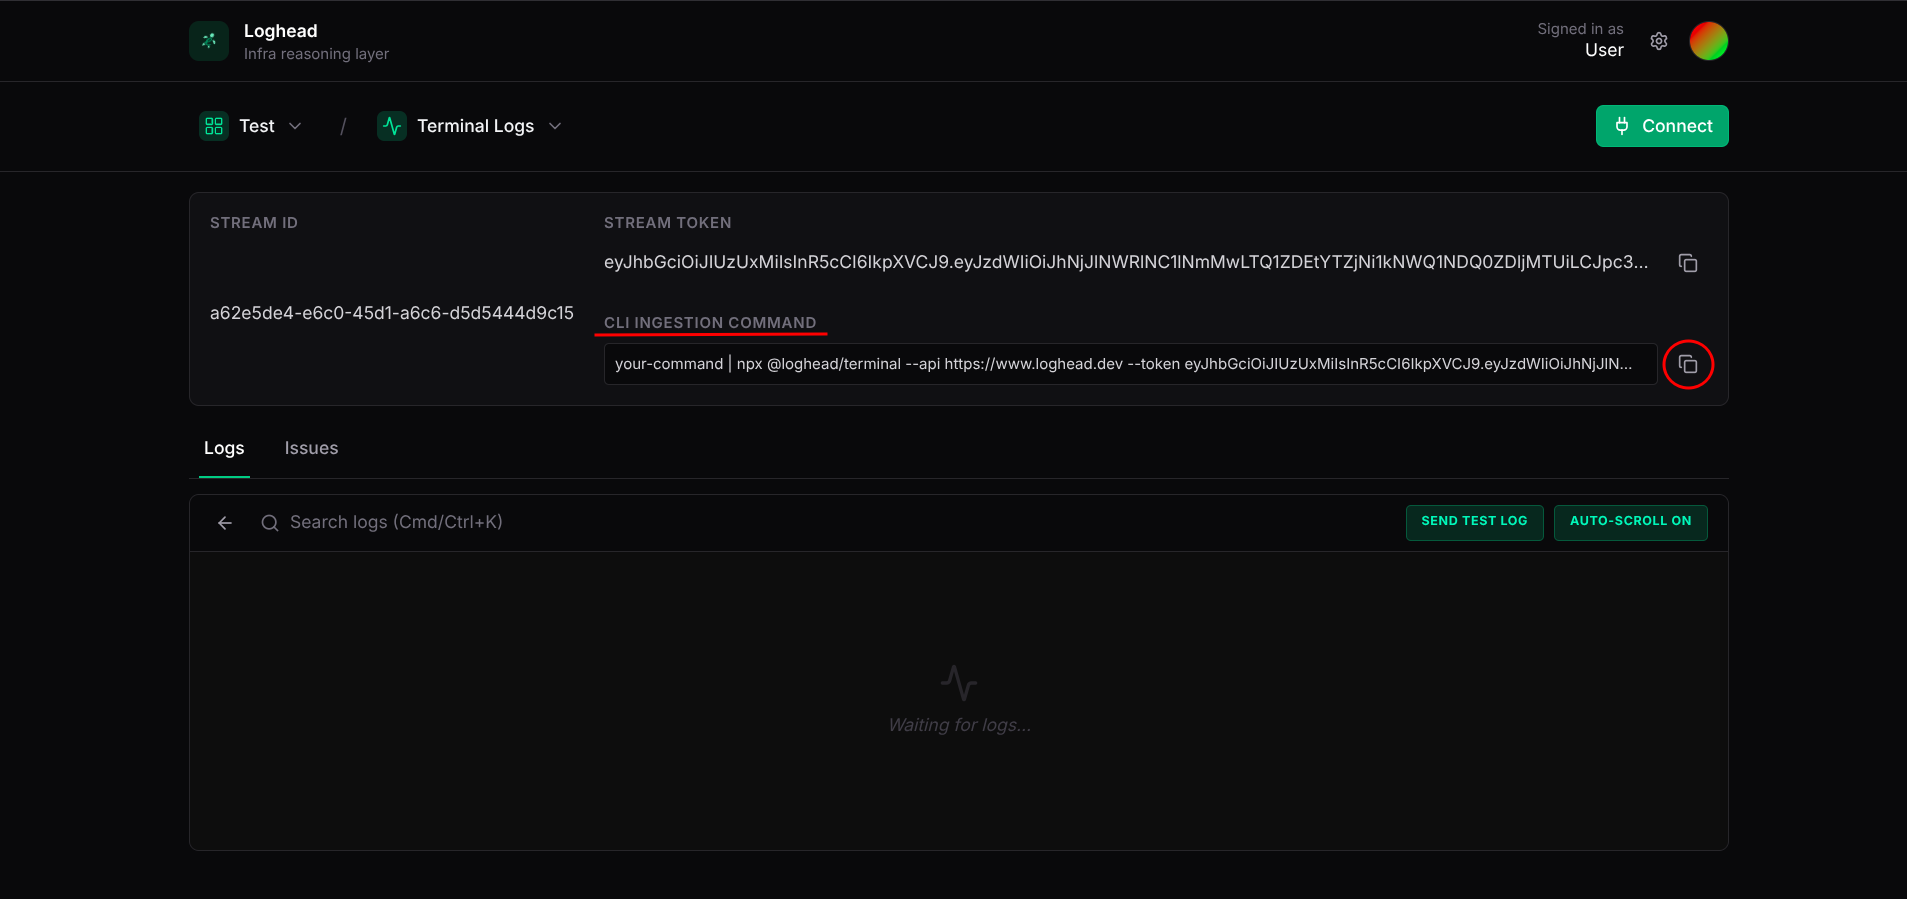
Getting Started via the UI

By following the solution steps above, you can securely stream any standard output directly into your cloud dashboard. After successfully sending your first terminal logs, try exploring the Search and Analytics tabs in the Loghead Cloud UI to filter your CLI logs by severity, timestamp, and specific keywords.

Ready to modernize
your logging workflow?

# Other Integrations